There are three elements of resources exists in Kubernetes, which are: CPU, Memory and Disk. By default 0.5CPU, 256mi resources are allocated per container.
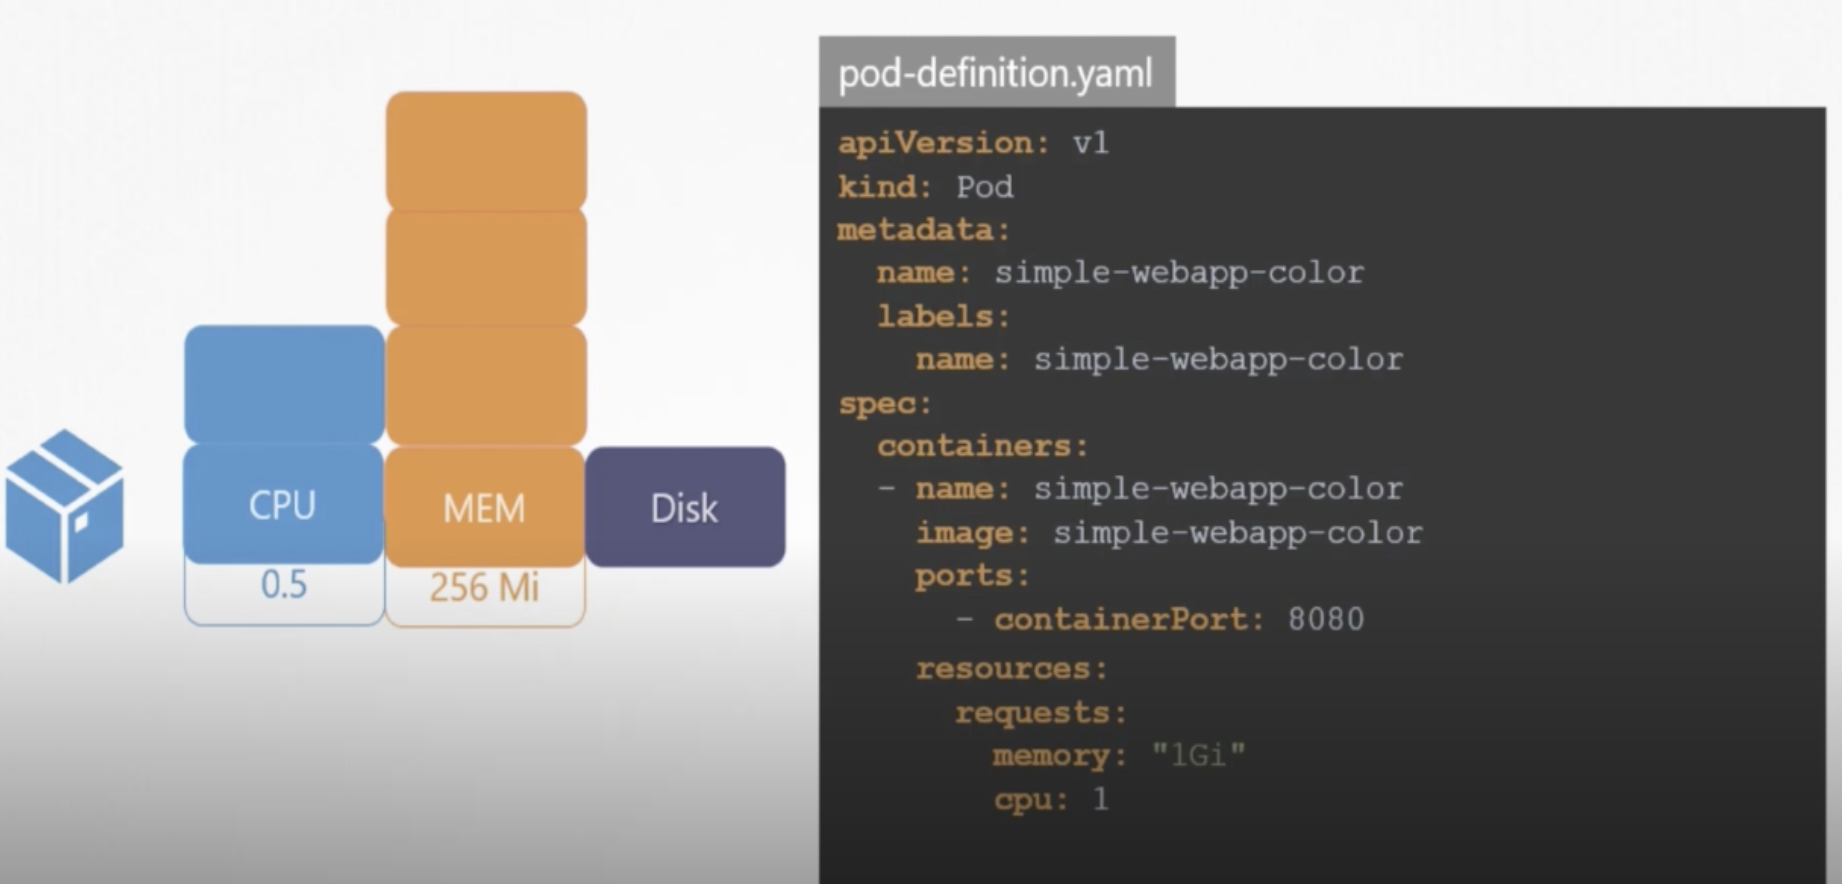
As it is depicted above in pod-definition.yaml file, we can request specified resources necessary to our container. CPU’s minimum count can be equal to 0.1 which is equal to 100m (m stands for milli). 1 count of CPU equals to 1 vCPU (in each cloud).
Limits for the resources can be also defined in yaml file under the resources section as follows:
...
...
spec:
    containers:
       - name: simple-webapp-color
         image: simple-webapp-color
         ports:
           - containerPort: 8080
         resources:
            requests:
                memory: "1Gi"
                cpu: 1
            limits:
                memory: "2Gi"
                cpu: 2
If pod exceeds the limit, then kubernetes throttles the CPU but if memory goes beyond the limit constantly then pod is terminated.
Taints and Tolerations
Taints are applied to nodes, tolerations are applied to pods. This is how the overal structure of taint declaration looks like “kubectl taint nodes node-name key=value:taint-effect”. Here is example case:
kubectl taint nodes node1 app=blue:NoSchedule
Taint-effecte can have following three values:
- NoSchedule
- PreferNoSchedule
- NoExecute
Here is how the toleration is added to pod definition file:
apiVersion:
kind: Pod
metadata:
    name: myapp-pod
spec:
    containers:
        - name: nginx-container
          image: nginx
    tolerations:
        - key: "app"
          operator: "Equal"
          value: "blue"
          effect: "NoSchedule"
double quote must be used for the values
Node Selectors
We can label the nodes and tell the pods on which nodes it should be sited by their label
apiVersion:
kind: Pod
metadata:
    name: myapp-pod
spec:
    containers:
        - name: nginx-container
          image: nginx
    nodeSelector:
        size: LargeLabel
Node can be labeled as follows:
kubectl label nodes node-1 size=LargeLabel
Multi-Container PODs
Sometimes two services need to work together, for example web-server and log-agent. In this cases we must have a two containers in a single pod. To do that we can add multiple containers under the spec of pod-difinition file.
There are three type of patterns of multi-container pods are there:
- Sidecar
- Adapter
- Ambassador
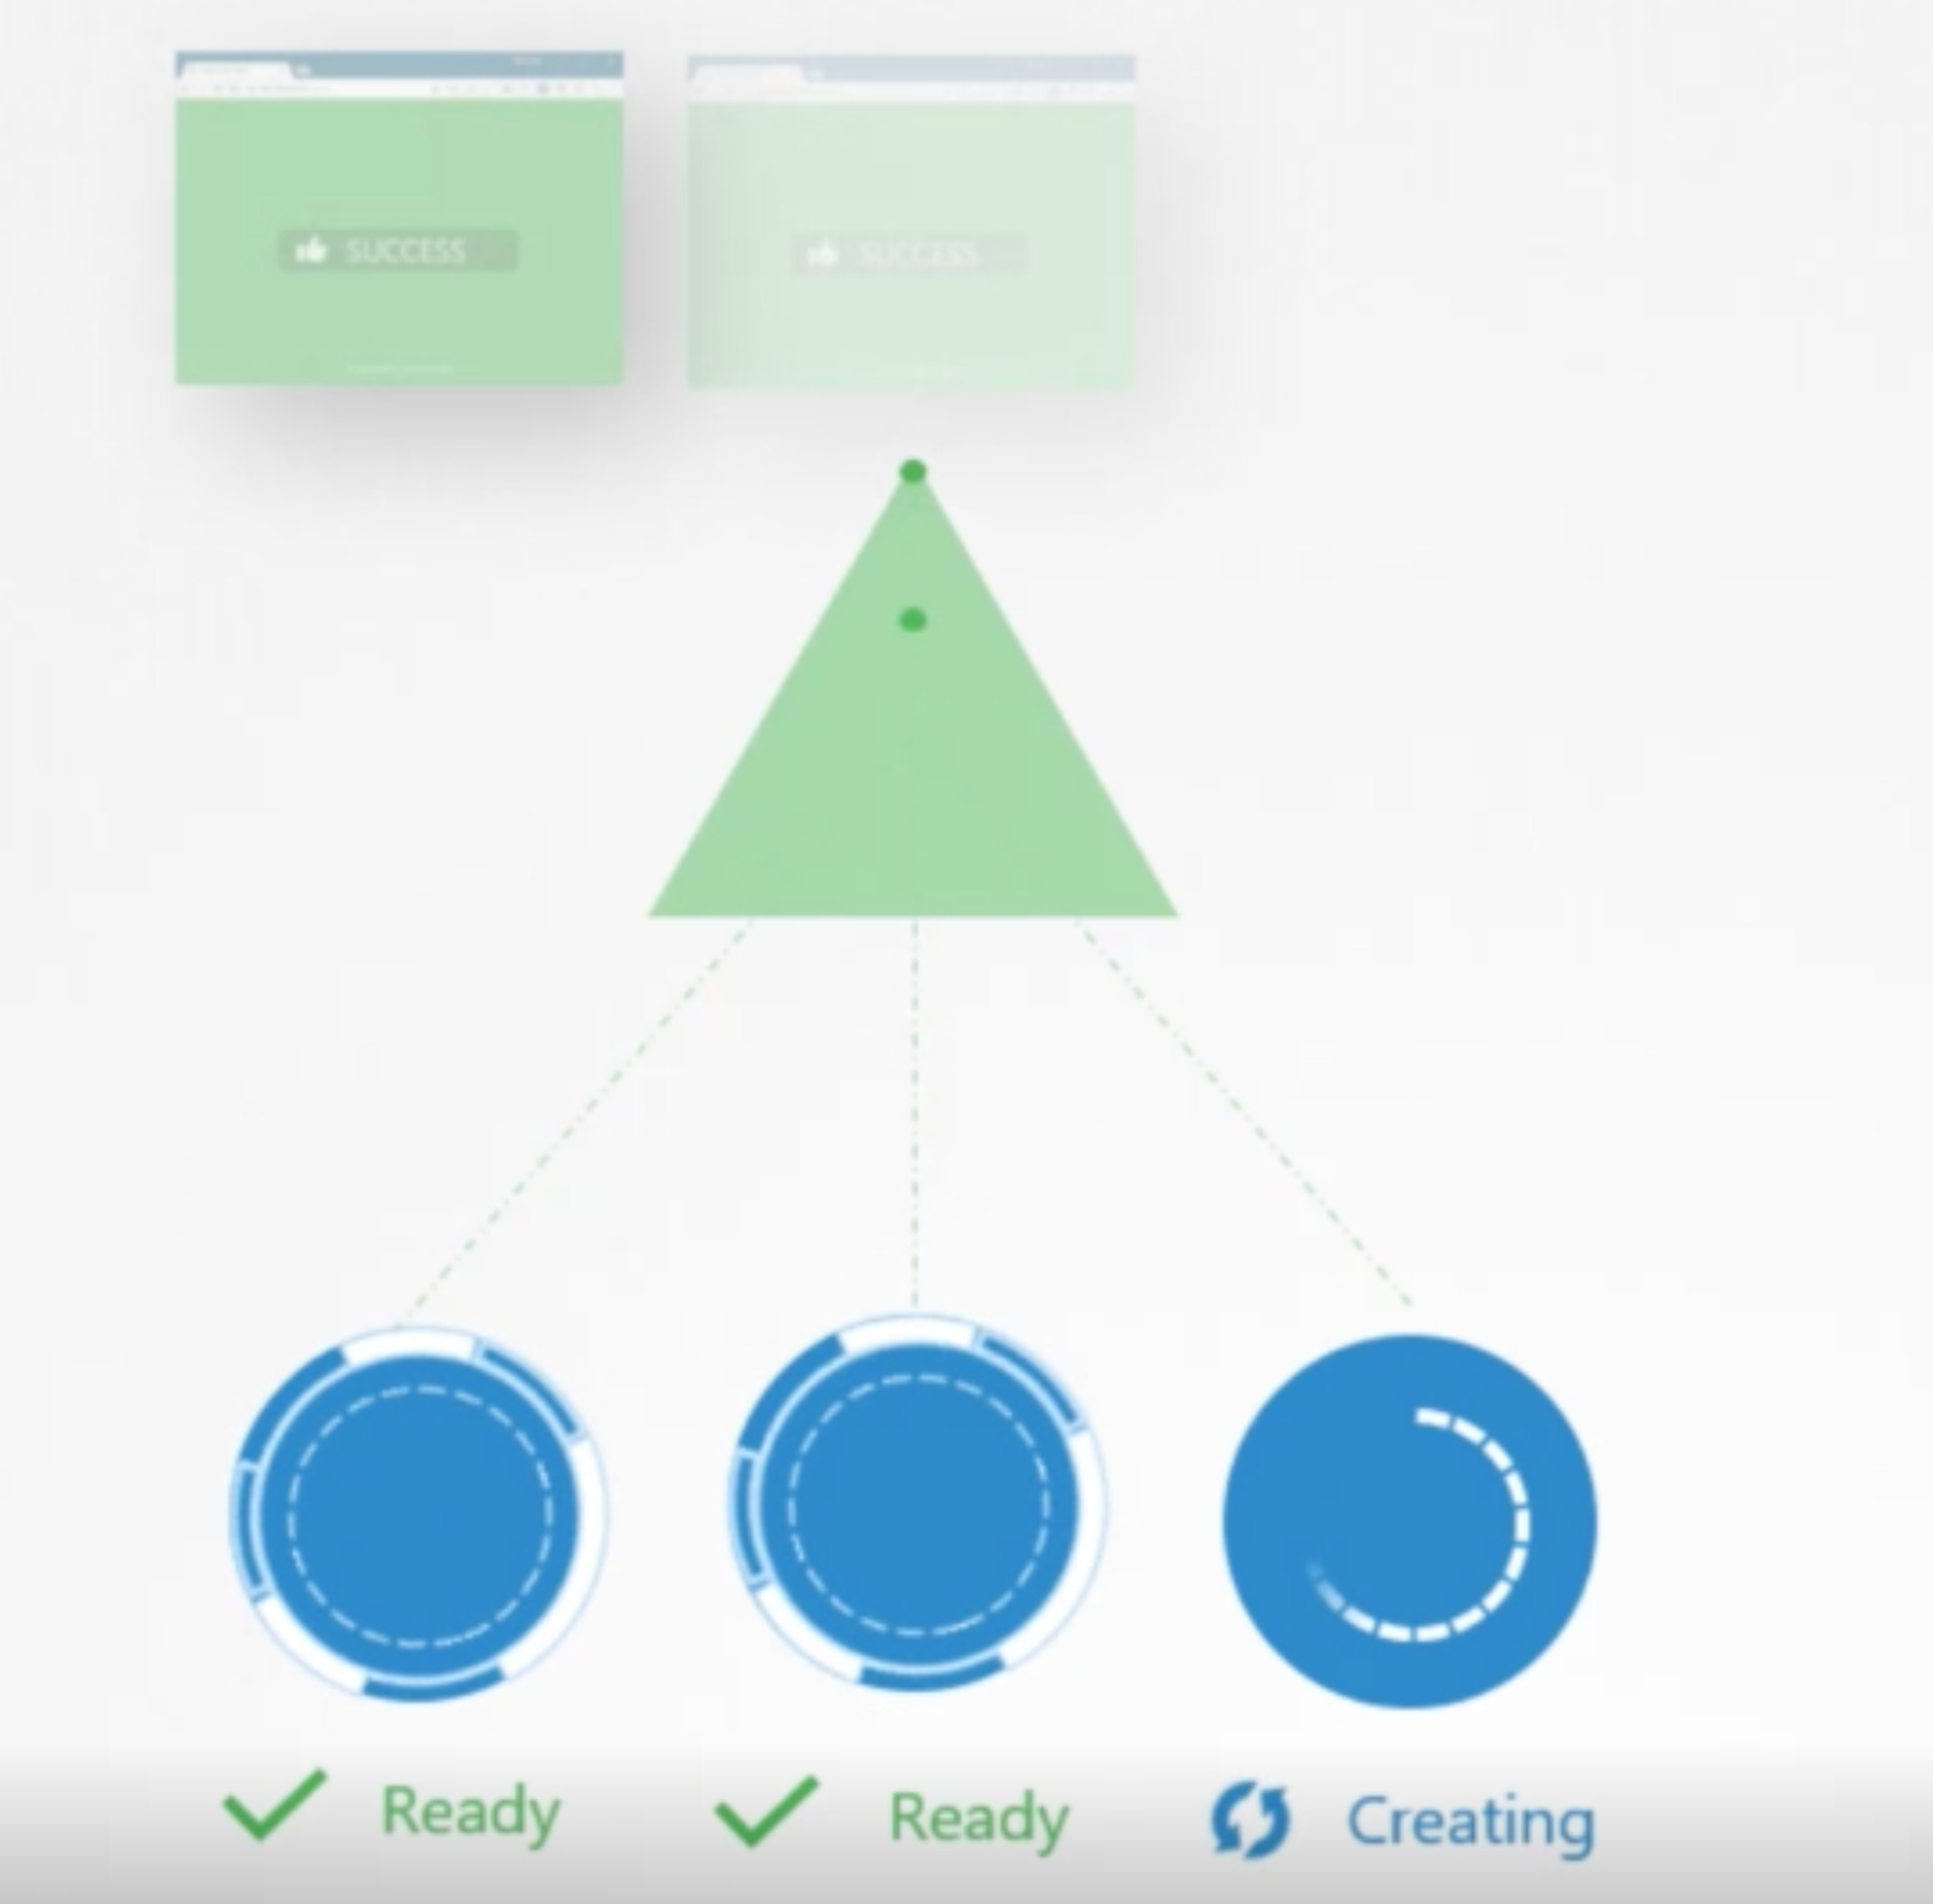
POD Conditions
Pod may be in following conditions:
- PodScheduled
- Initialized
- ContainersReady
- Ready
to check the pod condition try kubectl describe pod command. When the kubernetes cluster sees the condition Ready it considers the pod is fully ready and goes to the next step. Next step means the end-user http requests may start flowing into the pod. But It loading the container doesn’t mean the service has fully started and ready functioning. It may cause user request misses. In order to avoid this readiness probe has been introduced which is responsible to let the kubernetes cluster know about status of the pod.
HTTP Test Readiness Probe
apiVersion: v1
kind: Pod
metadata:
    name: simple-webapp
    labels:
        name: simple-webapp
spec:
    containers:
        - name: simple-webapp
          image: simple-webapp
          ports:
            - containerPort: 8080
    readinessProbe:
        httpGet:
            path: /api/ready
            port: 8080
In above example Kubernetes performs test on /api/ready controller until it returns positive response. Additional options that are added under readinessProbe as follows:
- initialDelaySeconds - initial wait time before starting to do health-check (warm up time)
- periodSeconds - how often the check must be performed
- failureThreshold - number of times kubernetes must try before deciding this pod is failed to start (default: 3)
TCP Test
The following example returns ready condition when the suckessfull socket connection happens on port 3306
readinessProbe:
    tcpSocket:
        port: 3306
Exec Command
Not sure how this one works !
readinessProbe:
    exec:
        command:
            - cat
            - /app/is_ready
Liveness Probes
Liveness probe is checking the health of the application within the container. Liveness also configured in a pod-definition file same as readiness probe is configured.
apiVersion: v1
kind: Pod
metadata:
    name: simple-webapp
    labels:
        name: simple-webapp
spec:
    containers:
        - name: simple-webapp
          image: simple-webapp
          ports:
            - containerPort: 8080
    livenessProbe:
        httpGet:
            path: /api/ready
            port: 8080
Similar to readiness probes additional TCP Test and Exec Command based liveness probes are exist.
Container Logs
For one-pod one-container case
kubectl logs -f workload-2-XXXXXXXXXX-fw6hn --namespace=kube-public
If there are multiple containers under the pod, then it shouldd be mentioned
kubectl logs -f workload-2-XXXXXXXXXX-fw6hn container-1 --namespace=kube-public
kubectl logs -f workload-2-XXXXXXXXXX-fw6hn container-2 --namespace=kube-public
Monitoring and Debug Applications
For the sake of usage example we talk about “Metrics Server” monitoring solution (other solutions can be used instead: ELK, DATADOG, Prometheus, …) which works IN-memory.
Kubernetes runs kubelet agent on each node. Kubelet inside uses cAdvisor agent that collects performance logs from pods.
metrics-server can be checked out from github (https://github.com/kubernetes-sigs/metrics-server.git) and deployed as a pod on a kubernetes (kubectl create -f deploy/1.8+/)
when the metrics-server is installed, we can see the performances of the nodes by using following command:
kubectl top node
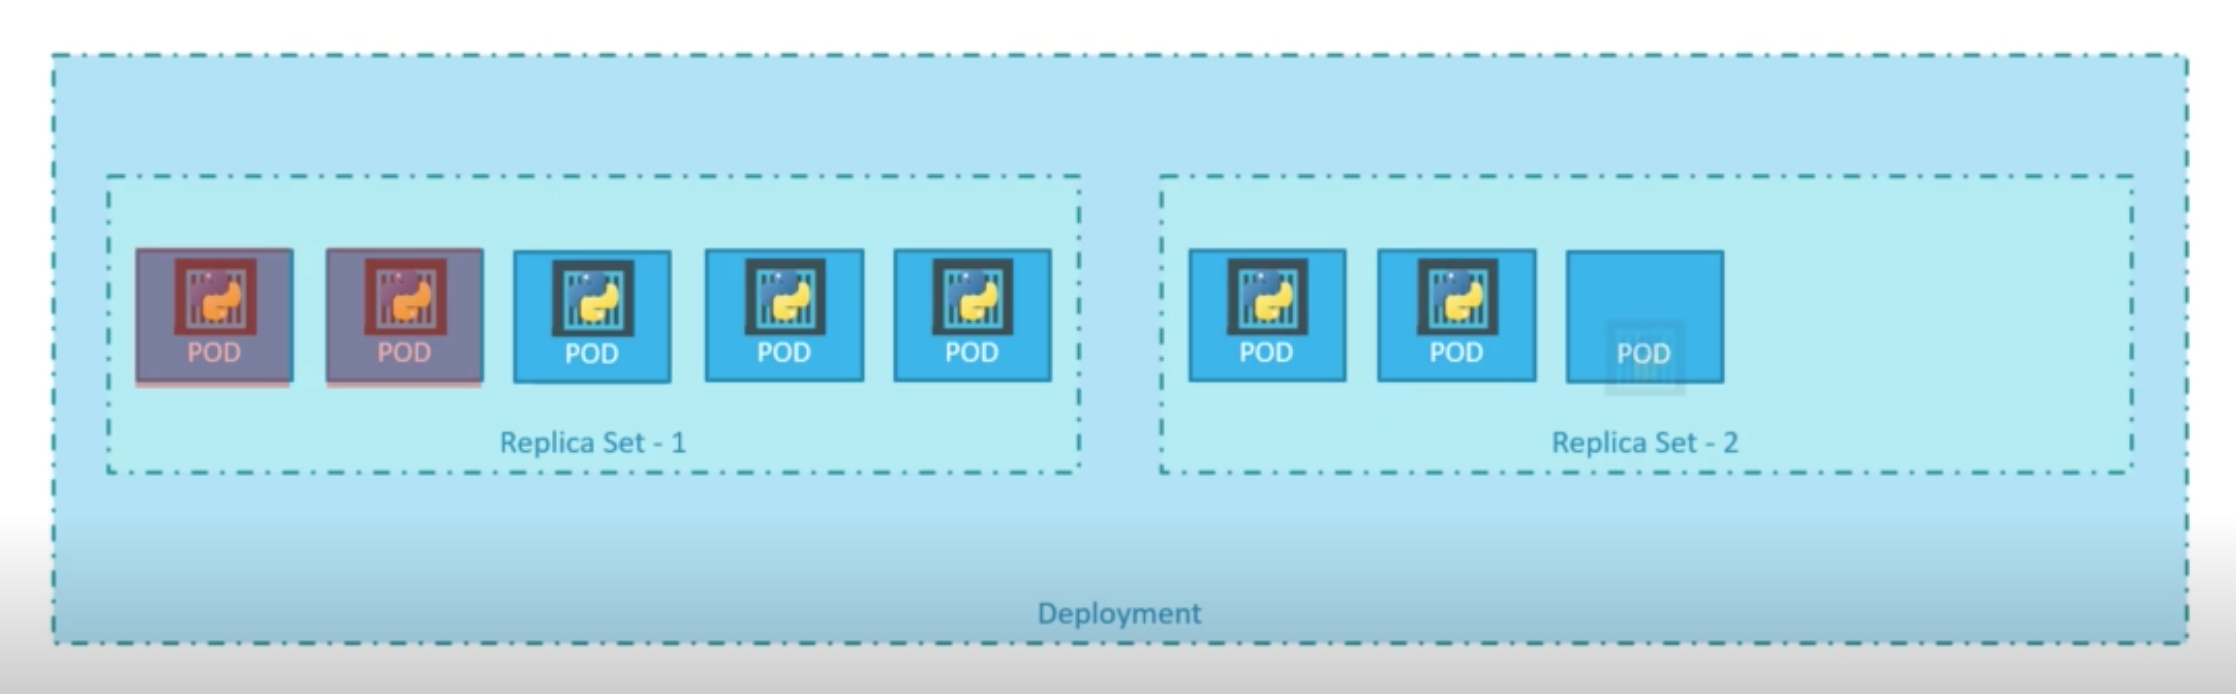
Rolling Updates & Rolbacks in Deployments
To see the rollout status information about deployment following command can be used:
kubectl rollout status deployment/myapp-deployment
kubectl rollout history deployment/myapp-deployment
There are two types of deployment strategies
- Recreate Strategy - application is down and service disconnection happend
- Rolling Update Strategy (default strategy) - application never goes down and upgrade goes seamless
To rollback the deployment do the following:
kubectl rollout undo deployment/myapp-deployment
Volumes
In order to have a persistent disk we can mount image’s storage with a host storage as follows:
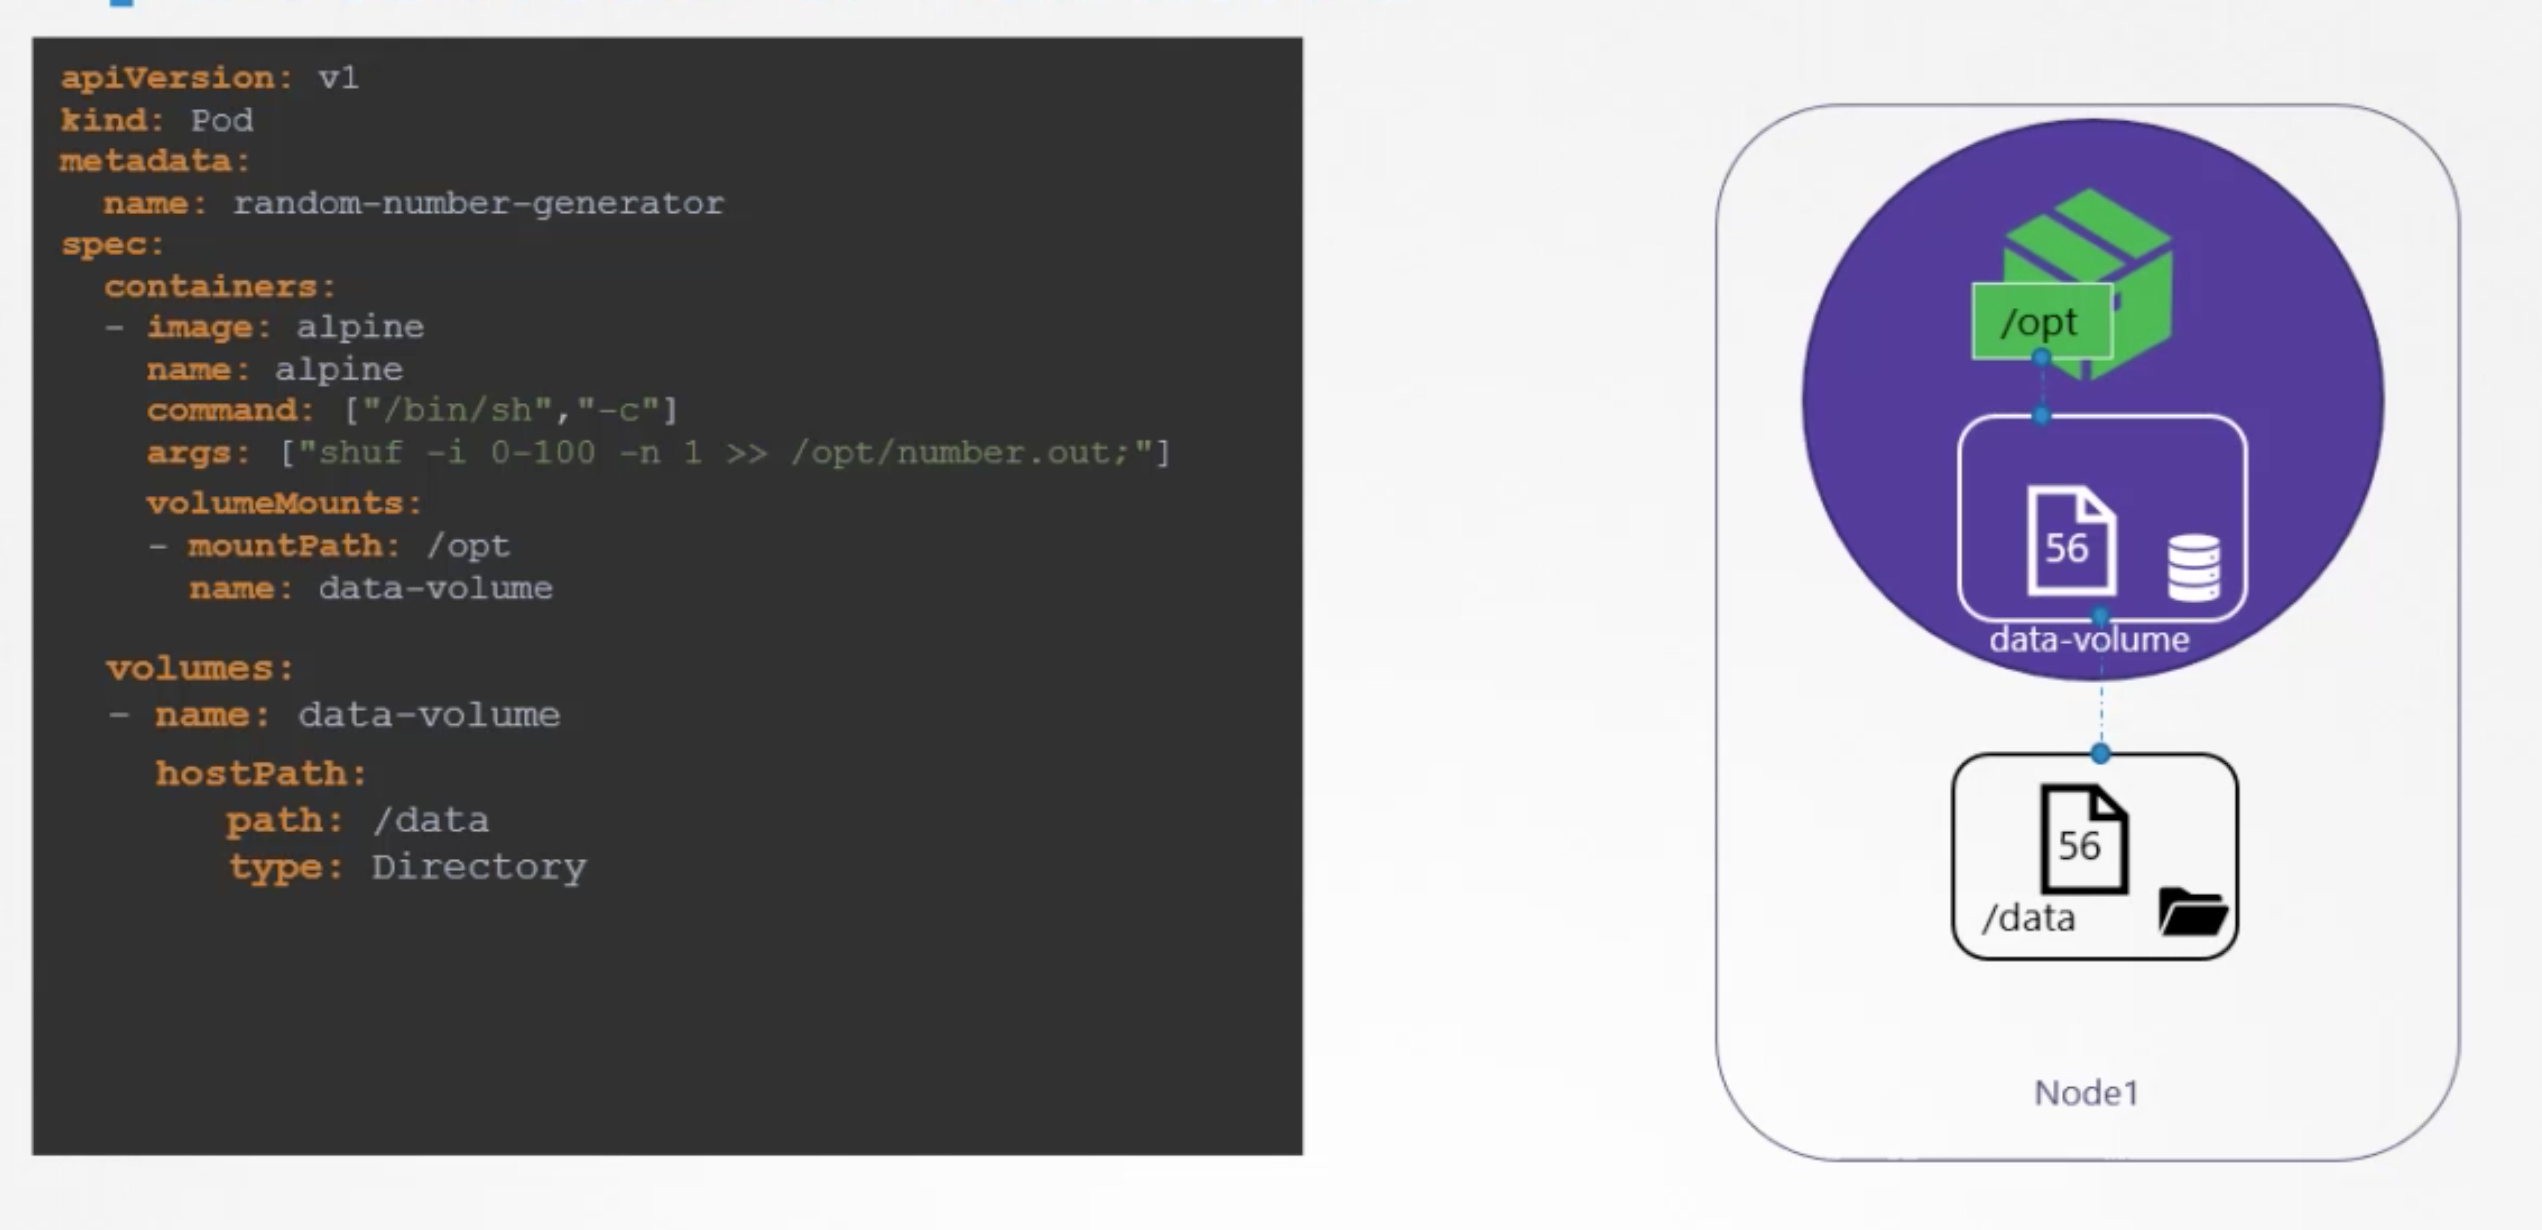
It works fine and as planned in case of single host, but if we have multiple hosts then /data folder will be on the host which helds the pod. So it may cause some issues for us later when we need to collect stored info from /data.
That is why distributed file-systems are widely used, here is example of usage AWS-EBS:
volumes:
- name: data-volume
  awsElasticBlockStore:
    volumeID: <volume-id>
    fsType: ext4